top of page

WeM@CH | A Business, Finance, and Communications IT System
Anchor 1
Line Chart on Potential Projected Revenue for 25,000 to 100,000 Users using the system once per day

Column Chart on Potential Projected Revenue for 25,000 to100,000 Users using the system once per day

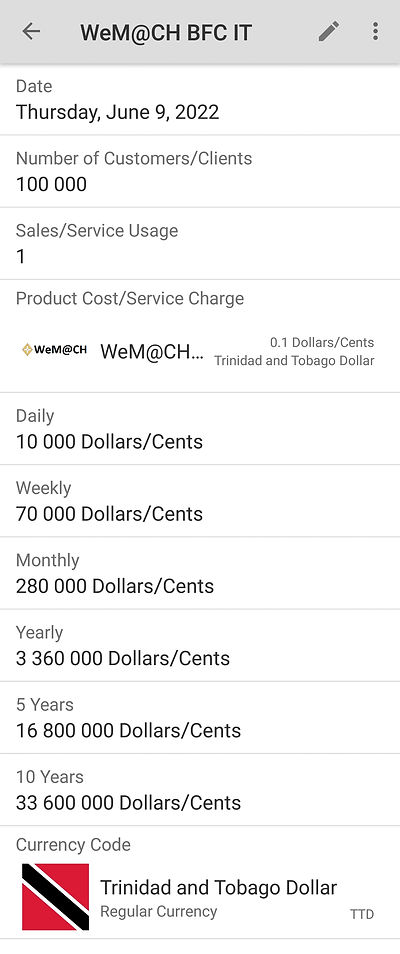
Potential Projected Revenue for 100,000 Users using the system once per day
Potential Projected Revenue for 25,000 Users using the system once per day

Potential Projected Revenue for 25,000 Users using the system once per day by $0.10 increase

Based on once per day usage at $0.10 per transaction. The investment capital and operating costs are based on actual costs from the developer and subject to change. Payroll expenses and taxes are based purely on deduction assumptions.

Based on once per day usage at an increase by $0.05. The investment capital and operating costs are based on actual costs from the developer and subject to change. Payroll expenses and taxes are based purely on deduction assumptions.

Potential Projected Revenue for 50,000 Users using the system once per day

Potential Projected Revenue for 25,000 Users using the system once per day by $0.05 increase

Based on once per day usage at $0.10 per transaction. The investment capital and operating costs are based on actual costs from the developer and subject to change. Payroll expenses and taxes are based purely on deduction assumptions.

Based on once per day usage at $0.10 per transaction. The investment capital and operating costs are based on actual costs from the developer and subject to change. Payroll expenses and taxes are based purely on deduction assumptions.

Based on once per day usage at an increase by $0.10. The investment capital and operating costs are based on actual costs from the developer and subject to change. Payroll expenses and taxes are based purely on deduction assumptions.


Bar Chart on Potential Projected Revenue for 25,000 to 100,000 Users using the system once per day
bottom of page